


Statistics
The statistics dashboard
Bookings, hours, court occupancy and most active players, filterable in one click.
The statistics dashboard summarises your club's activity over the period of your choice: number of bookings, hours booked, occupancy rate, active players and booking amount. Everything updates immediately when you change a filter, and almost every chart can be clicked to refine the analysis.
1Open the dashboard
In the left-hand menu, click Statistics. The shortcut Statistics on the home page also takes you there.
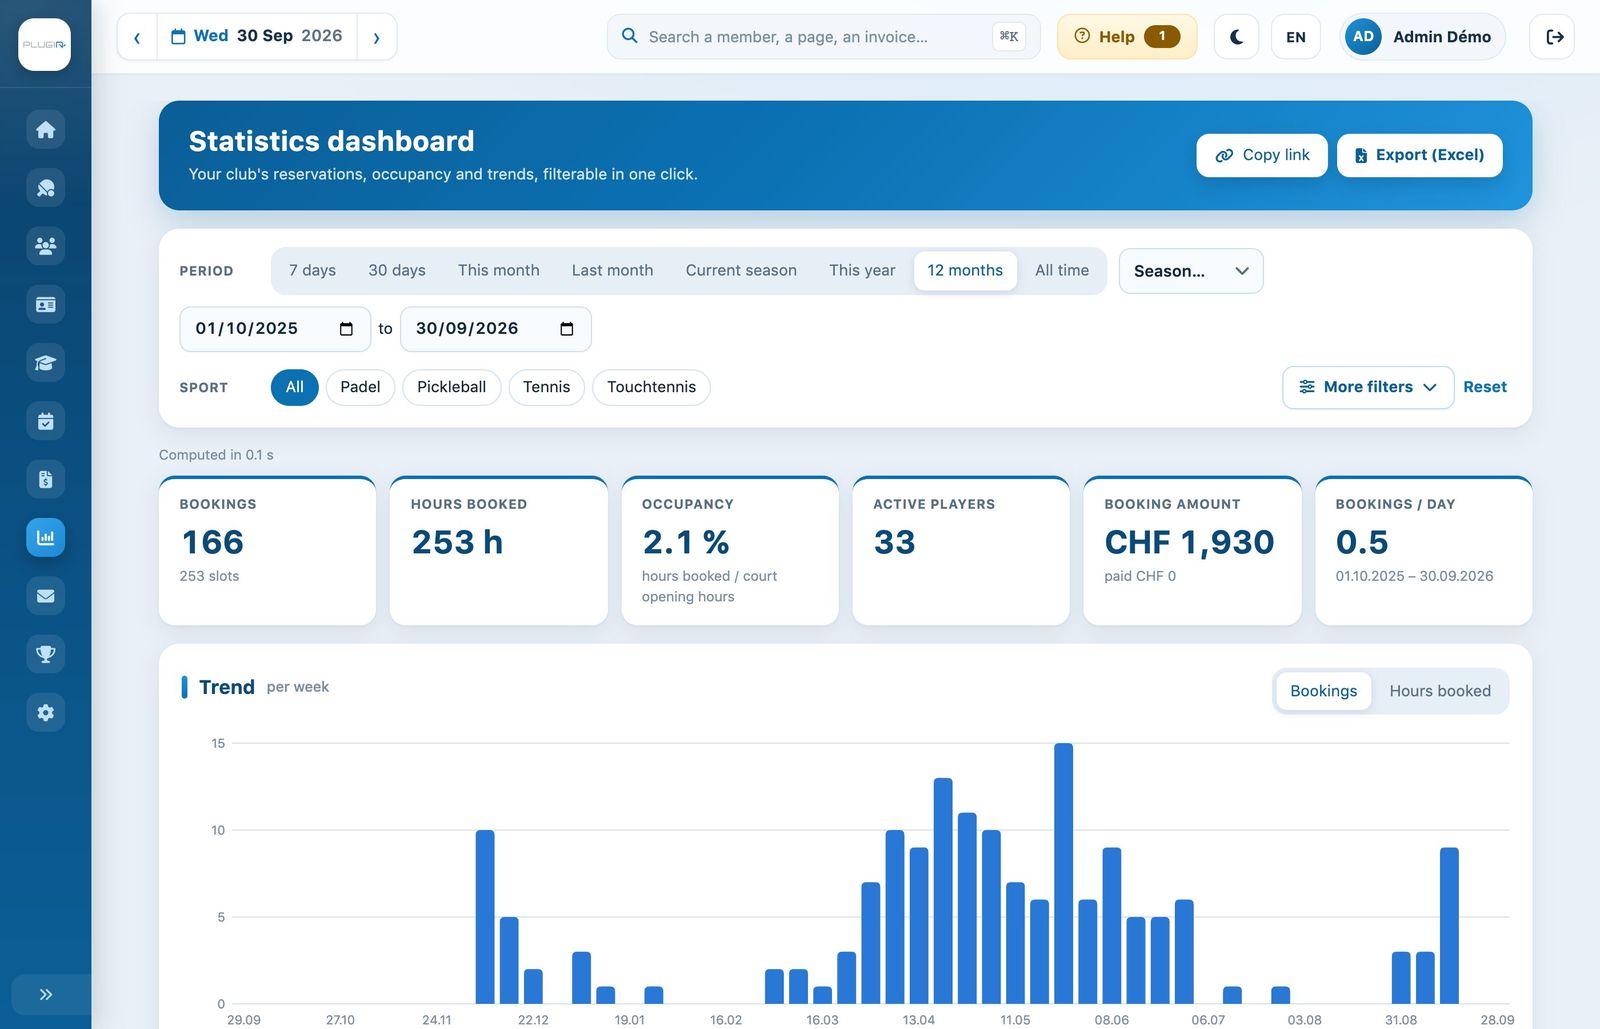
The period and sport filters, then the key figures.
2Choose the period and the sport
- Period: click 7 days, 30 days, This month, Last month, Current season, This year, 12 months or All. The list Season… selects the dates of one of the club's seasons, and the two date fields allow a custom period.
- Sport : All or a single sport.
- More filters opens additional filters: courts, days of the week (Weekdays or Weekend), time range, booking kind, seasons, person, recurrence and subscription type.
- Reset returns to the default filters.
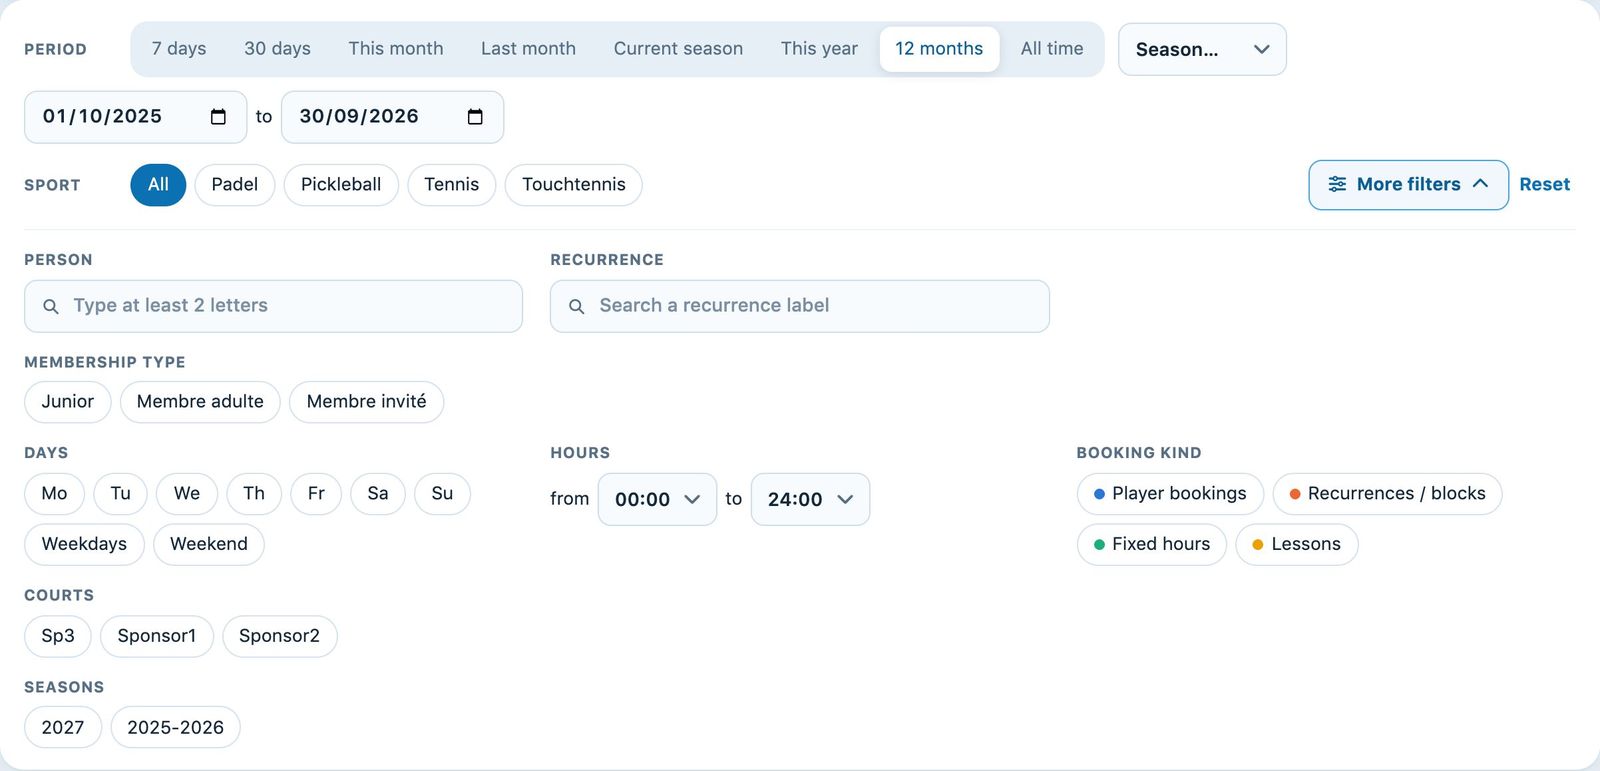
The additional filters, opened with “More filters”.
Filters add up: each tag narrows the result. Several choices in the same filter mean one or the other, for example two courts. The filter Person finds a member's bookings as a player, as the person responsible, and their recurrences.
3Reading the key figures
| Figure | What it measures |
|---|---|
| Reservations | The number of bookings in the period, with the number of slots booked. |
| Hours booked | The total time booked on the courts. |
| Occupancy | The hours booked divided by the courts' opening hours. |
| Active players | The number of different people who played. |
| Reservation amount | The price of player bookings (excluding fixed hours, courses and recurrences), with the share already paid. |
| Bookings / day | The daily average over the period. |
Below each figure, the comparison shows the change compared with last year (same period) when the period is longer than a month, otherwise compared with the previous period.
4Explore the charts
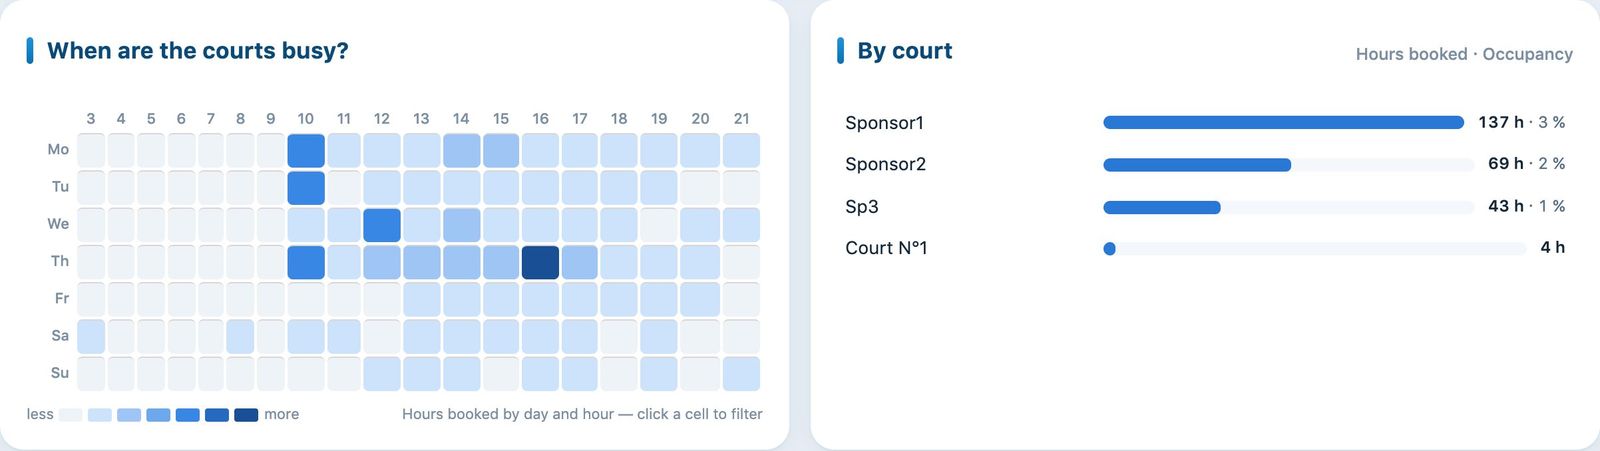
Occupancy by day and hour, and the breakdown by court, kind and sport.
- Trend: bookings (or hours booked) per day, week or month. Click a bar to zoom in on that period.
- When are the courts busy?: hours booked by day and hour; the darker the cell, the busier the slot. Click a cell to filter on that day and hour.
- By court, By kind, Per sport and By season: the breakdown of activity. Click a row to filter.
- Most active players: the members who booked the most. Click a name to see their bookings.
5View and export bookings
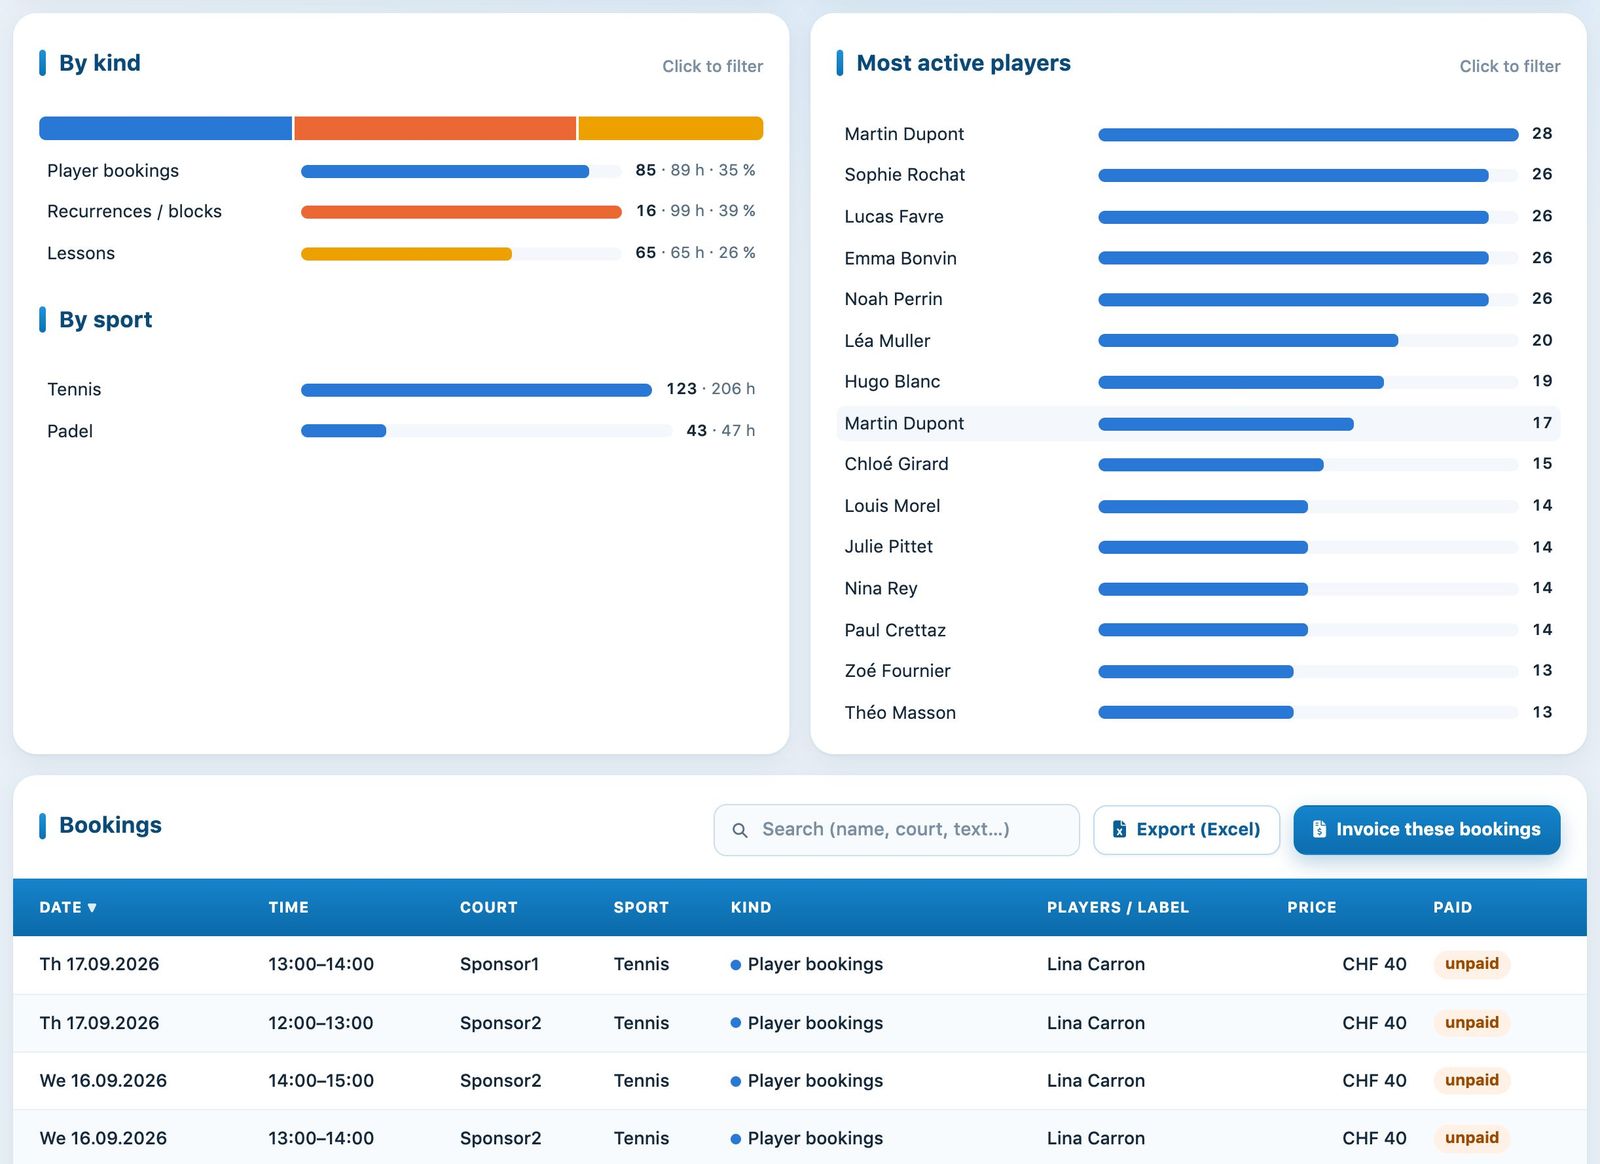
The most active players and the detailed list of bookings.
The list Reservations details each booking matching the filters: date, time, court, sport, kind, players, price and payment status (paid, unpaid or absent). The search field filters by name, court or text, and Show more loads the rest of the list.
- Export (Excel) downloads all bookings for the selected filters, even beyond those shown on screen.
- Copy link, at the top of the page, copies the dashboard address with your filters: another administrator who opens it sees exactly the same view.
- Invoice these bookings creates invoices from the list. See the article Invoicing bookings from the statistics.
Ideas for use: spot off-peak hours to schedule courses or attractive rates, compare occupancy from one season to the next before setting opening hours, and measure the effect of a new court or a new offer.
Plugin.ch Tutorial — Statistics